Consistency & Streaks
Track how regularly you post and see how your cadence correlates with engagement.
What it is
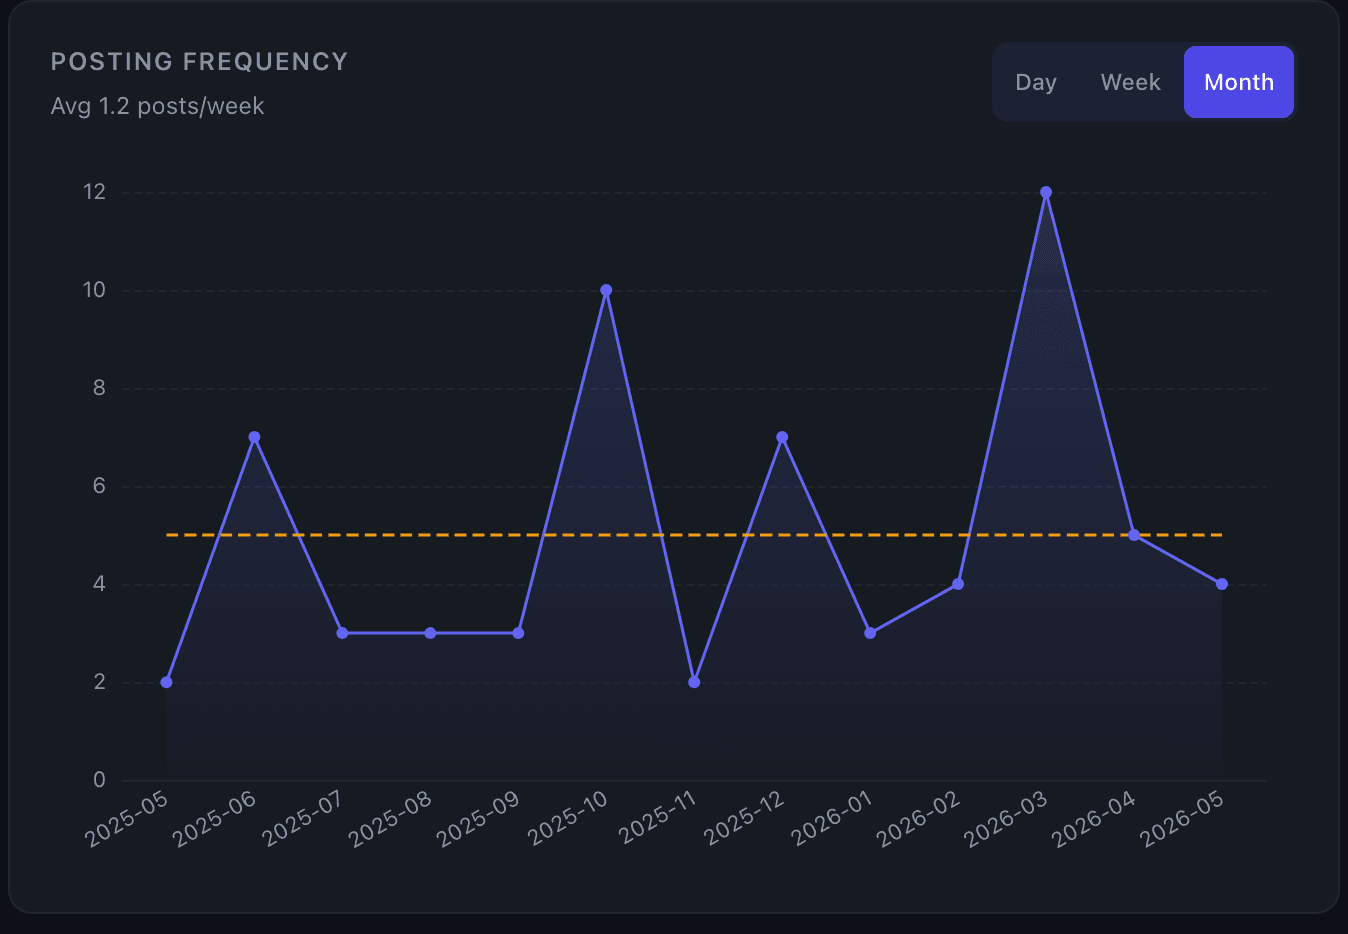
Consistency & Streaks is a posting-frequency chart on your dashboard that shows how many posts you published per day, week, or month over your selected date range — with a dashed average line so you can immediately spot gaps and bursts against your normal pace.
How it works
The chart plots your original posts only — reposts and quote posts are excluded. A dashed amber line marks your average posts per bucket (day/week/month) for the period. An insight line below the chart summarizes your average posts per week across the full window.
The Weekly Email Digest carries the streak signal between dashboard visits: it tells you how many consecutive weeks you've posted, or flags that you missed last week and by how much your average engagement tends to drop after a gap. Streak nudges appear there, not as push notifications.
A streak counts as any calendar week with at least one original post.
Key details
Granularity — The chart respects the granularity control at the top of the dashboard (day / week / month). At day granularity, posts render as bars; at week or month granularity they render as an area line. Switch granularity in the Time Controls.
Tooltip — Hover any bar or data point to see the exact post count for that bucket and the period average.
Average line — The dashed line is your mean posts per bucket across the visible date range, recalculated whenever you change the date window.
Excluded content — Reposts and quote posts don't count toward cadence. Only original content you authored is tracked.
Tips
- Use week granularity to spot multi-week patterns (e.g. a holiday slowdown or a sprint after a product launch) without the day-to-day noise.
- If your weekly digest mentions a drop after a gap, pull up the day-granularity view to see exactly which week you went quiet.
- The average line is your personal baseline — compare it against the Performance Overview to see whether heavier weeks actually moved engagement.