Post Length Analysis
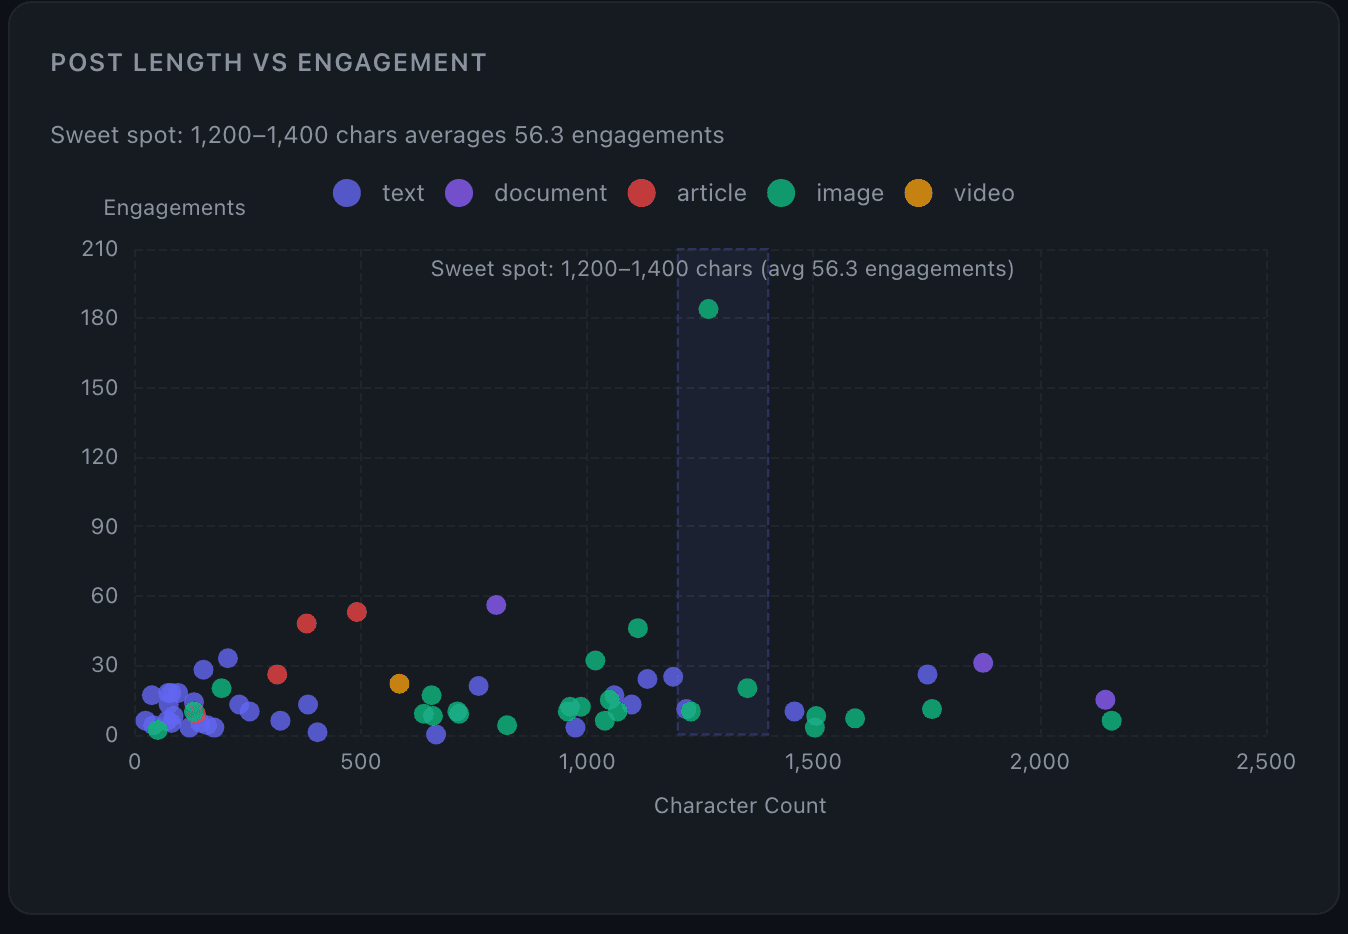
A scatter plot that maps every post's character count against its engagement, so you can see whether length actually affects your results — and if so, where your sweet spot is.
What you see
Each dot is one of your posts. The X axis is character count; the Y axis is whichever engagement metric you have selected (impressions, reactions, comments, or a rate). Dots are color-coded by post type (text, image, video, article, document, link), and a legend lets you see the breakdown at a glance.
Hovering a dot shows a tooltip with the character count, metric value, and a short preview of the post text.
Sweet spot detection
If your data shows a meaningful cluster of high-performing posts in a particular length range, the chart highlights it with a shaded band labeled Sweet spot: X–Y chars (avg Z reactions). The band represents the 200-character bin that has the highest average engagement across at least 3 posts.
If no band appears, your engagement isn't correlated with post length — which is itself a useful finding. The chart won't fabricate a pattern that isn't there.
Key details
- Reposts and quote posts are excluded — only original content is analyzed.
- The sweet-spot calculation requires at least 5 posts total, and a qualifying bin needs at least 3 posts. If your account is new or has few posts, the band may not appear yet.
- The metric and date range respect the filters set in the time controls. Switch the metric toggle to see how length correlates with different measures of performance.
Tips
- If you write a mix of post types, try filtering by a single type in the time controls to see whether the sweet spot shifts — a 1,000-character text post and a 1,000-character document post may perform very differently.
- The sweet-spot band updates as your date range changes. Narrowing to the last 90 days can reveal whether your audience's preferences have shifted over time.
- No sweet spot showing? That can mean your audience responds to content quality or topic more than length — look at the Content Type Breakdown and Top Posts to find what's actually driving engagement.